The Body Mass Index is a proxy for state of health. You divide a person’s mass (weight) in kilograms by their height in metres squared. The formula is simple: BMI = kg/m2. If you have a BMI between 18.5 and 25, you are considered normal. Less than 18.5 and more than 25 are of concern, and more than 30 means you are classified as obese.
The BMI is an example of a proxy that is easy to calculate, and maybe why it is used so often. This creates a dilemma for the medical community in that it is not particularly effective as a proxy for state of health, as it fails with athletes, pregnant women, the elderly or young children. It does not account for people who are muscular, and it does not account for those who are have an active lifestyle even though their BMI is higher.

The good part of the BMI is that it is easy to calculate. The bad part is the result may not be particularly accurate in getting an answer to the question being asked: what is the state of my health?
This reliance on an approach that is “easy to calculate” got us wondering what are some of the proxies we use in commercial real estate that provide a quick synopsis of some aspect of the market, and do they suffer similar shortcomings as BMI does in being a proxy for state of health.
Some of the “easy to calculate” proxies commonly used in commercial real estate include cap rate, price per suite, net effective rent and vacancy rate.
Cap(italization) Rate
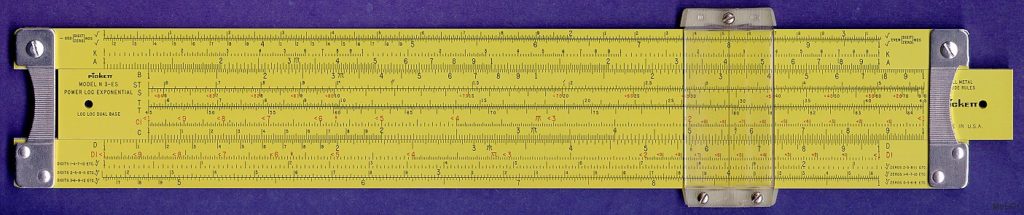
The cap rate is a snapshot of the rate of return offered by a property. It is the ratio of the net operating income to the purchase price in the sale of a property. It is easy to calculate, and most people get the same result. You could do the math on a slide rule.
The cap rates achieved by sales of similar properties are used to determine the market value of other properties. Some elements as to how a cap rate can mislead include:
- what income counts in the determination of net operating income? Is it the income in place at the time of the sale, is it the projected income assuming some vacant space is leased, or if some renewals occur, and at what general vacancy factor, if any, is being applied?
- are there contracted increases in rent such that the return to the investor increases in the first few years of ownership?
- are the existing rents below, at, or exceeding current market rents?
- how long does the assured (income-in-place) income last?
- how secure is the assured income, i.e. how likely is it that the tenants providing the assured income will pay their contracted rent?
- is the buyer levered or a cash buyer?
- how do you deal with above market vacancy rate in the property now?
Cap rates can mislead as it is a function of being a relative measure, as opposed to being an absolute measure. Oftentimes the yield buyers expectation or demand is a function of how that property compares to others, and that means an adjustment for location or quality or credit or assured income duration or physical or functional or locational obsolescence.
Perhaps the most misleading aspect in making use of a cap rate is determining whether the cap rate generated the pricing (the price paid is a result of a cap rate preference), or if the cap rate emerged from the underwriting and business case (there were other factors at play determining how it got priced and that results in the cap rate paid). This is similar to being a cause or a symptom respectively.
Price per Suite
Take the purchase price, divide by the number of apartments and this results in a price per suite. It is a “symptom” of the sale, in the sense that what drove pricing was a return on net operating income and that value is then used to calculate the price per suite. You could again calculate this with a slide rule.
Some of the elements as to how price per suite can mislead includes:
- there is no homogeneity to suite size, so it is hard to know if you are comparing “apples to apples”.
- if there is some inclusion of ancillary income – parking, storage, ground floor retail – that could again result in concerns about “apples to apples” comparisons.
- it is not easy to account for amenities offered and their impact on both the rent achieved, the sustainability of the rent and its impact on turnover.
- it is hard to establish if the resultant price per suite is based on at market, above market or below market rents.
An example may help. Let’s imagine two identical apartment buildings renting suites at $2.50 per square foot per month. In one building, all the units are 1-bedroom apartments of 500 sf each. In the second, all the units are 2-bedroom apartments of 1,000 sf each. One has twice as many suites as the other, and the same net operating income as the rent per square foot . The two buildings sell at the same cap. One has a price per suite twice of the other. Is it a better deal? Does this proxy for value help?
Eventually you would expect a price per suite to decline over time as capital is re-invested to repair and upgrade suites, and the chattels provided – stove, oven, refrigerator, microwave, washer, dryer – need repair or replacement. As well, over time there is functional obsolescence in the suite design (e.g. en suite bathrooms) and it is not clear if that impact emerges in this proxy for value.
This is likely an emergent proxy, kind of a check at the end of the determination of value, to ensure that the value proposed feels good. It seems unlikely that many investors begin their analysis with price per suite in order to determine return.
Net Effective Rent
An “easy to calculate” proxy for rental rates is net effective rent.
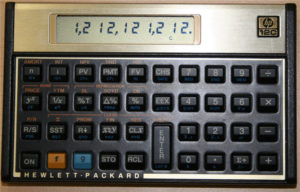
The net effective rent is the rent paid by a tenant over the lease term net of all costs to secure the tenant – tenant inducement, free rent, commissions, etc. – discounted to a present value and then expressed as a dollar amount per square foot payable over the term of the lease. It is more difficult to calculate, and for that the HP 12C came in real handy.
Net effective rent analysis allows a landlord to compare deals of various term lengths, rents and rent steps, premises sizes, and inducements. The net effective rent is used to establish the “market” rent a landlord can expect to achieve in a submarket.
Some of the elements as to how net effective rent can mislead include:
- not every owner uses the same discount rate in its calculation of its net effective rent.
- net effective rent is usually calculated over “rentable” area and that can gloss over differences in the ratio of usable to rentable areas between buildings.
- there can be differences between buildings as to how much tenant improvement allowance is necessary to accommodate the tenant, which means different NERs could win over the same occupant.
- how do you account for out of term costs, like the carrying cost of waiting for the lease to commence, and factoring in the time to complete all necessary leasehold improvements?
- does it account for differences in base building costs necessary to secure the tenant?
- the net effective rent calculation glosses over just how much space is necessary to house any particular tenant, as it may change between buildings.
- the tenant may incur different additional costs beyond the tenant improvement allowance provided in order to fit out the space to their satisfaction, and that “cost” is outside the net effective rent calculation.
- the net effective rent determined is at odds with the metric used by the tenant, as the tenant will consider all its costs of occupancy. A gross effective rent is more likely the calculation used by the tenant, and maybe utilized on a usable area basis.
- the tenant improvement costs in total are at odds with the credit of the tenant, or the ability or willingness of the owner to pay these costs. Leasehold improvements in the Ottawa office market typically range from $50 psf to over $100 psf and that can be a sizable investment to fund. That can affect the resultant net effective rent by glossing over the tenant contribution to leasehold improvement costs.
Net effective rent is easy to calculate, however it can be difficult to collect robust information about the costs incurred to win the bid. As well, this proxy is beginning to show signs of the impact of degrees of freedom (the number of variables that are free to vary in statistical analysis) as there are more considerations subject to different interpretations and standards (e.g. discount rate, out of term costs, etc.) at play.
Price per suite has fewer degrees of freedom making for a simple calculation, while net effective rent may not have consistent determination amongst market participants. This proxy has its weaknesses when applied as a market statistic due to degrees of freedom issues, as it is way harder to ensure “apples to apples” comparisons.
Maybe more to the core of its potential shortfall is that it is not a proxy equally valued by either party to a lease transaction. The proxy is good for landlords as they determine what will this deal cost them. The measure for the tenant is more typically what is the total cost of this lease, and that goes beyond the net rent to include operating costs, how well they fit in the space (i.e. just how much area they occupy and pay rent on) and what additional initial costs they incur. That could mean that the low net effective rent proposed by a landlord may not correspond to the low gross effective rent option available to a tenant.
Vacancy Rate
An “easy to calculate” proxy for the strength of a leasing (sub)market – office, industrial, multi-residential, retail – is the vacancy rate. The vacancy rate is the proportion of space available for lease within a market divided by the size of the “competitive” market.
This proxy for the strength of a leasing market could ideally indicate whether:
- it is a landlord’s market or a tenant’s market;
- if tenant demand will result in multiple bids for existing vacancies;
- rents are declining, staying the same or increasing;
- there is widespread ownership of the competitive inventory or is it an oligopoly; and,
- new supply will lead to higher rents and increased absorption.
Some of the elements as to how the vacancy rate can mislead include:
- the denominator for the calculation is the “competitive” inventory, not the universe of inventory. Here in Ottawa that “competitive” office inventory excludes buildings that are owned and occupied by a firm, and ignores 108 buildings and 17 million square feet owned and occupied by the Government of Canada in a market tracking 45 million square feet of competitive supply. That overhang of “shadow supply” can have a significant impact on the dynamics of the “competitive” supply depending on the market.
- for years the office vacancy rate in the central business district in Ottawa was low single digits. The dilemma was that there was little leasing activity, and vacant space stayed vacant for extended periods. A low vacancy rate does not necessarily lead to conditions that favour landlords.
- for years the office vacancy rate in the Kanata suburban market was mid-teens, however there were times that any mid-sized availability attracted interest from multiple tenants making conditions favour the landlords. A higher vacancy rate does not necessarily mean that conditions favour tenants.
- not all vacant space is the same. If what space is vacant does not meet tenant demands, the space has no utility to the tenant. If a tenant is looking to secure 20,000 square feet, availability of 15,000 square or less or more than 30,000 square feet may be immaterial. What matters is how many options does that tenant have that could work.
- the location of vacant space may preclude it from consideration by a tenant. A company may not be prepared to move significantly outside their existing sub-market, or move to a suburban market or move to the central business district. There may be less willingness to migrate between sub-markets.
- not all vacant space is the same if there is a supply oligopoly. Once again using Kanata as an example, the largest landlord there owns 60% of the competitive market. Oftentimes its buildings represented 50% or more of the options available to a tenant. What was misleading in the vacancy statistics was how few choices of different owners affected the negotiating position of tenants in that market.
- the timing around space being occupied, unoccupied and available can get weird. Larger office tenants are committing to new premises 18-24 months before taking occupancy. Is the space they are committed to taking still count as vacant even though it is no longer competing for tenants? Is the space it currently occupies now counted as vacant seeing as the landlord is now competing for a replacement tenant, or does it count as available but occupied?
- how space becomes occupied can make vacancy rates a little misleading. For example, the Government of Canada like many large employers has been reducing the space allocated per employee as it modernizes its work practices. That means existing vacant space can effectively house more employees than previously, and that implies that there needs to be more employment growth to deal with the same level of absorption.
One owner of a one million square foot office complex thought that any less than 5% vacancy gave them too little flexibility to deal with tenants expanding or contracting or renovating their premises. That meant 50,000 square feet remained empty on purpose. We seem to ignore the “empty on purpose” vacancy that likely should be part of every (sub)market.
Another worthy discussion debates what vacancy rate is optimal, optimal in the sense that there is a balance between a landlord’s market and a tenant’s market for any particular (sub)market. Too often it seems like the goal is no vacancy whatsoever, and that leads to problems with tenant expansion and retention within any one building. There is an occasional discussion of what constitutes a balanced market, and that again seems to be a relative (as opposed to absolute) scale.
The Cushman & Wakefield America’s Occupier Conditions Market Outlook 2017-2019 is revealing as to how a vacancy rate may or may not suffice as a proxy for the office leasing market.
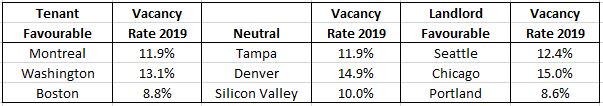
Please note that Cushman made the vacancy rate projections as of 2016. We are not concerned about the accuracy of the predictions, but interested in how their combination of forecasts for rent growth, demand momentum and supply momentum affects their favourability ranking.
Scanning their results, it does seem odd that Chicago will be landlord favourable with a vacancy rate of 15%, Boston will be tenant favourable with a vacancy rate of 8.8%, and Denver is a balanced market as is Silicon Valley, even though Denver has 500 basis points more vacancy.
The point of all this
It is much easier to discuss the state of the market by using proxies, or models, in the hope that the proxy or model is a good shorthand indicator for the market as a whole. These proxies for information germane to commercial real estate have their limitations and shortcomings. We prefer to think they are best used to start a conversation or discussion, and not end it. The value is often times uncovering the nuance that results from a more thorough analysis. Given that the winning bid is often within 1% of the other bids, that nuance is likely vital.
As with all statistics, one hopes that the suggestive bit leads to that discussion of the vital bit.

What are some market statistics that you find insufficient for what they attempt to suggest? Are their other measures that are better at encapsulating the vital?
One thought on “Just what is the BMI equivalent in commercial real estate?”
Illuminated little analogies – Thank you.
Better definition of the KISS principle: Keep it simple… and smart.
BMI, the slide rule – Quite humorous. Notwithstanding the need for more robust models for more detailed scenarios, I still like my 12C by the way. When you have grown up with that little pocket rocket, it kind of stays with you. Who wants to really give up reverse Polish notation when your brain has been wired for it? 😉 It will certainly go down as iconic (geek) pop culture. It wryly marks time; our time.
To progress and all the things we learn and opportunities created, along the way!